JavaScript Stats: Practical Metrics for 2026
Explore practical JavaScript stats: how developers measure performance, adoption, and reliability. Learn methods, tools, and best practices for data-driven coding in 2026.

JavaScript stats refer to measurable metrics that track performance, adoption, and reliability of JavaScript code across projects. In 2026, developers focus on metrics like load time, bundle size, and memory usage, using tooling to guide refactors and optimizations. These numbers help teams compare frameworks, test optimizations, and communicate value to stakeholders.
What javascript stats capture in modern apps
In practice, javascript stats capture the health and performance of web applications. They describe user-perceived performance, code health, and adoption of modern patterns. Core metrics include Time to Interactive, First Contentful Paint, Largest Contentful Paint, Cumulative Layout Shift, and Total Blocking Time. Memory-related metrics and event-loop delays also matter for responsive UX. This section explains what each metric means and why teams pay attention to it. According to JavaScripting Analysis, 2026, organizing metrics around user impact improves prioritization and reduces feature-churn. When we talk about javascript stats, we are really talking about actionable signals that help teams debug, optimize, and communicate value. The right mix depends on stack, framework, and deployment strategy.
Instrumentation: turning data into signals
Turning raw numbers into actionable signals starts with deliberate instrumentation. Establish baseline metrics such as time to interactive (TTI), first contentful paint (FCP), largest contentful paint (LCP), cumulative layout shift (CLS), and total blocking time (TBT). Then choose data collection strategies: Real User Monitoring (RUM) in production to reflect real conditions, and synthetic testing in staging for controlled experiments. Use the Performance API (Navigation Timing, Resource Timing, User Timing), and consider the PerformanceObserver for streaming data. Separate measurement from interpretation: label events clearly, annotate with context (screen, route, user segment), and store data with timestamps. Build dashboards that translate raw numbers into decision-ready signals; set thresholds and alerts that notify teams when budgets are breached. JavaScripting analysis in 2026 emphasizes aligning metrics with user impact and business goals.
Key metrics you should monitor
Every project benefits from a core set of metrics that tell you whether users are having a good experience. Focus on:
- Time to Interactive (TTI): when the page becomes usable; track across devices.
- First Contentful Paint (FCP) and Largest Contentful Paint (LCP): how quickly content appears, with attention to mid- and long-range loads.
- Cumulative Layout Shift (CLS): visual stability during loading.
- Total Blocking Time (TBT): length of long tasks preventing interaction.
- Memory usage and garbage collection activity: watch heap allocations and potential leaks.
- Code-splitting and lazy loading coverage: measure how much JavaScript is loaded upfront.
- Freshness and invalidation signals: how recently assets and data were updated. Use these as a living budget; complement with user-centric signals like time to first interaction and smoothness of interactions.
Practical benchmarks and interpretation across apps
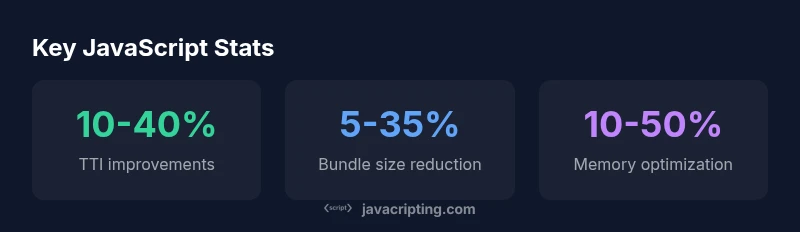
Interpretation of JavaScript stats depends on app type and audience. In content-heavy sites, LCP and CLS often dominate, while highly interactive applications prioritize TTI and TBT. Benchmarks should be contextual: a personal blog can tolerate modest delays, whereas enterprise dashboards demand tight interactivity. When comparing frameworks or architectures, rely on relative budgets rather than absolute values; a 20–40% reduction in TTI is common after code-splitting and asset optimization. Perform blind tests to ensure improvements hold across devices and networks. JavaScripting Analysis, 2026 shows that teams tying metrics to user journeys ship improvements faster and with clearer business impact.
Tools and workflows for JavaScript stats
To operationalize stats, combine browser-provided data with purpose-built tooling. Core options include:
- Performance APIs (Navigation Timing, Resource Timing, User Timing, Long Tasks) to collect precise timings.
- Web Vitals and Lighthouse for automated scoring, budgets, and guidance.
- Real User Monitoring (RUM) platforms to capture real-user experiences across devices and networks.
- Profilers like Chrome DevTools Performance panel and React DevTools for deep dives into rendering behavior.
- Node.js telemetry (process.memoryUsage(), CPU profiling) to monitor server-side aspects in universal apps.
- Data visualization and dashboards to present trends to stakeholders. Follow a cadence: baseline, experiment, measure, and report.
Implementing a repeatable, data-driven cadence for 2026
Establish a repeatable workflow that scales with teams and product velocity. Start by defining a minimal, measurable set of metrics aligned with user journeys. Instrument across layers, collect both RUM and synthetic data, and store it in a centralized analytics store. Create dashboards with budgets and alerting rules, and run controlled experiments when introducing significant changes. Schedule regular reviews with product, design, and engineering to interpret trends and decide on optimizations. Document lessons learned and update budgets accordingly. The JavaScripting team recommends maintaining discipline around data quality: consistent instrumentation, timestamped records, and clear context for every data point.
Common JS performance metrics and best practices
| Metric | What it measures | Best practice |
|---|---|---|
| Time to Interactive | Page responsiveness timing | Target budgets and track across devices |
| Bundle size | Size of JavaScript payload | Code-split and lazy-load assets |
| Memory usage | JS heap allocations | Monitor with Performance API and leaks detection |
| Layout stability | CLS during loading | Prioritize visual stability in critical paths |
Questions & Answers
What is the most important JavaScript performance metric?
The most important metric depends on the user task, but Time to Interactive and Core Web Vitals often guide prioritization because they directly affect perceived responsiveness.
The most important metric depends on the user task, but TTI and Core Web Vitals often guide you because they affect perceived responsiveness.
Which tools should I start with to measure JavaScript stats?
Begin with Lighthouse and Web Vitals for automated checks, then add Real User Monitoring to capture actual user experiences. Chrome DevTools and Performance APIs provide deep diagnostics.
Start with Lighthouse and Web Vitals for checks, then add Real User Monitoring. Use Chrome DevTools for deeper diagnostics.
How often should I measure performance in a project?
Measure continuously during development and at release milestones. Establish a cadence for periodic reviews (e.g., every sprint) and after major feature rollouts.
Measure throughout development and at each release, with regular reviews each sprint or after big features.
What’s the difference between RUM and synthetic metrics?
RUM reflects real user experiences across devices and networks, while synthetic testing uses scripted scenarios to run consistent benchmarks in controlled environments.
RUM measures real users; synthetic tests are controlled experiments with repeatable scripts.
How can I reduce bundle size effectively?
Employ code-splitting, lazy loading, tree-shaking, and remove dead code. Audit dependencies and consider alternative libraries with smaller footprints.
Split code, load on demand, remove unused code, and audit dependencies to shrink bundles.
Can I rely on JavaScript stats alone to judge UX quality?
Metrics are essential, but they must be complemented by qualitative user research and usability testing to understand real-world impact.
No—metrics are crucial, but combine them with user research to understand actual UX impact.
“Data-driven debugging is the key to meaningful improvements; metrics only matter when they correlate with real user experiences.”
What to Remember
- Define clear performance budgets and measure against them.
- Prioritize metrics tied to real user impact.
- Instrument with both RUM and synthetic tests.
- Use code-splitting and lazy loading to reduce load.
- Share results with stakeholders using visuals.