Debug in JavaScript Chrome: Practical Debugging Guide
Learn practical techniques to debug JavaScript in Chrome using DevTools, breakpoints, console, and performance tools with actionable steps and troubleshooting tips. This guide is designed for aspiring developers and frontend pros.

You will learn how to debug JavaScript in Chrome using DevTools, set breakpoints, inspect call stacks and variables, step through code, profile performance, simulate network conditions, and fix common issues with practical, repeatable steps and best practices. This quick answer sets up the approach and the essential tools you'll rely on across projects.
Why Debugging JavaScript in Chrome Matters
According to JavaScripting, the ability to debug JavaScript directly in Chrome accelerates learning and reduces debugging cycles by letting you see code execute in real time. Chrome DevTools provides a tightly integrated suite of tools that reveal how your code behaves across the runtime, network, and rendering pipeline. For aspiring developers, mastering these tools translates to faster issue isolation, clearer reasoning about app state, and a smoother progression from writing code to delivering features. This section explains why Chrome-based debugging is a foundational skill for front-end work and how it fits into a modern debugging workflow. You will learn to reproduce bugs efficiently, map errors to the exact line in your source, and verify fixes without leaving the browser context.
Core Chrome DevTools Features for Debugging
Chrome DevTools is a multi-tool suite. The Sources panel lets you set breakpoints, watch variables, and view the call stack. The Console is your interactive scratchpad for evaluating expressions and logging runtime state. The Network panel shows all HTTP requests and responses, including timing and payloads, which helps identify fetch-related bugs or performance bottlenecks. The Performance panel records a trace of your app’s runtime to reveal long frames, scripting hot paths, and layout thrash. The Elements panel shows the DOM and CSS, helping you connect UI changes to code execution. Finally, the Lighthouse integration offers automated audits for accessibility, performance, and best practices. Together, these tools enable a complete picture of how your JavaScript behaves under real-world conditions.
Setting Breakpoints: Types and Best Practices
Breakpoints are the primary mechanism for pausing code at the precise moment you want to inspect state. There are several breakpoint types you should know: line-of-code breakpoints, conditional breakpoints, and logpoint breakpoints that produce console output without pausing. You can enable breakpoints in the Sources panel by clicking on the line number or using keyboard shortcuts. Start with a simple, explicit breakpoint around the suspected bug location, then widen or narrow as needed. Conditional breakpoints are powerful for race conditions and data-dependent logic: attach a condition like x > 10 so the debugger pauses only when the condition is true. Logpoints help you observe variable values over time without stopping execution, which is ideal for long-running loops. As you place breakpoints, remember to use the call stack to trace back to the originating function and to inspect local vs. closure scope.
Tracing with the Console and Call Stack
The Console is not just for logging. You can use console.assert to enforce invariants, console.table to visualize arrays and objects, and console.time/console.timeEnd to measure performance windows. When combined with breakpoints, the console becomes a narrative of how your code reaches a result. The Call Stack panel shows the sequence of function calls leading to the current pause point; learn to navigate it to understand how data traverses through your modules. Practice using debugger statements sparingly; they are effective for quick, temporary pauses, but you should replace them with proper breakpoints in long-term debugging. If your code uses asynchronous constructs, pay attention to microtasks and macrotasks; pause points may appear in different turns of the event loop, so you’ll need to inspect promises and callbacks with care.
Inspecting Data with the Sources Panel and Local Overrides
The Sources panel exposes your repo as a file tree; you can map source files from a server or install local overrides to test changes without editing your production build. Local Overrides let you patch JavaScript and CSS files locally; changes persist across reloads, which is a huge time saver for iterative debugging. Explore the Scope and Watch sections to monitor variables, with the ability to add expressions you want to track. For modules loaded from multiple bundles, leverage the search and filter features to quickly locate the exact variable or function. When debugging modern bundlers (like Webpack or Vite), pay attention to sourcemaps; ensure the devtools are aligned with the transpiled code so your breakpoints correspond to the source you write.
Optimizing Debugging with Performance and Network Tools
Performance profiling helps you identify expensive operations, long layouts, and rendering bottlenecks that slide into your debugging workflow. Start by recording a performance profile while you perform the user action that triggers the bug; then analyze flame charts and bottom-up views to identify hot paths. Coupled with Network profiling, you can detect slow API calls, large responses, or caching issues affecting correctness and speed. If you can reproduce a bug offline or with a mocked API, isolate the environment so the debugging signal is clean. Use features like throttling to simulate slow networks and CPU throttling to emulate lower-end devices. Finally, integrate DevTools with your test runner or CI to verify fixes automatically.
Building a Repeatable Debugging Workflow
Create a standard workflow you can repeat across projects. Start by reproducing the bug in a clean environment, then systematically enable breakpoints, watch expressions, and network tabs to examine the root cause. Document findings in your issue tracker, including the exact lines paused, the state of key variables, and the observed vs. expected outcomes. After implementing a fix, re-run the original scenario and run a quick regression test to ensure nothing else broke. Save time by adding reusable DevTools snippets and snippets for common tasks (e.g., pause on first failure, inspect fetch responses). Finally, review dashboards with your team to align on best practices; consistency beats clever debugging tricks.
Tools & Materials
- Google Chrome browser(Latest stable version recommended)
- Debugged project repository (local copy)(Ensure source maps are available if using a build step)
- Code editor or IDE(For quick edits during debugging)
- Console and network tracking enabled(Keep DevTools open while reproducing the issue)
- Notepad or issue tracker(Document findings and steps to reproduce)
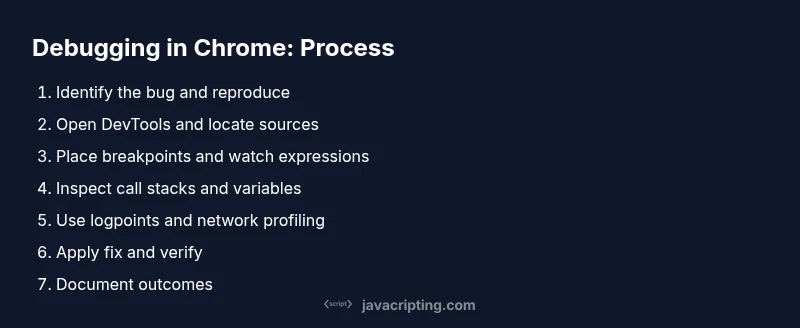
Steps
Estimated time: 60-90 minutes
- 1
Identify and reproduce the bug
Reproduce the issue in Chrome and note the exact user action that triggers it. Capture a minimal example that isolates the problem and avoids unrelated UI interactions.
Tip: Start with a clean state; disable extensions if they might interfere. - 2
Open DevTools and locate sources
Open Chrome DevTools (F12 or Ctrl/Cmd+Shift+I) and navigate to the Sources panel. Locate the suspected file in the file tree and set an initial breakpoint near the problem area.
Tip: Use Command-P (Ctrl-P) to quickly open a file by name. - 3
Add explicit breakpoints
Place a line breakpoint on a precise line of code where you suspect the bug originates. If the bug is data-driven, try a conditional breakpoint that pauses only when certain state is met.
Tip: Start with a narrow scope and expand as you learn more. - 4
Inspect variables and call stacks
When execution pauses, inspect local and closure variables, read the call stack, and trace back to the origin of the issue. Note where data first diverges from the expected state.
Tip: Hover variables to see live values; add watches for repeated checks. - 5
Use logpoints and console helpers
Leverage logpoints to print values without stopping execution. Combine console.table and console.assert to surface invariants and unexpected states during runtime.
Tip: Reserve logpoints for long-running loops to avoid frequent pauses. - 6
Profile performance and network
Record a performance profile while reproducing the issue and inspect flame charts for hot paths. Use the Network panel to identify slow requests or large payloads impacting behavior.
Tip: Toggle throttling to replicate real-user conditions. - 7
Apply a fix and verify
Edit the code or adjust logic, re-run the exact repro steps, and confirm the bug is resolved. Run a quick regression to ensure no new issues were introduced.
Tip: Document the exact change and why it works for future reference. - 8
Document and share the outcome
Summarize findings, create a minimal reproduction, and share the solution with teammates. Update tests if applicable to prevent regressions.
Tip: Create a reusable snippet for similar bugs in the future.
Questions & Answers
What is the first step to debug in Chrome?
Reproduce the bug in a clean environment and open Chrome DevTools to locate the failing code.
Reproduce the bug in a clean environment and open Chrome DevTools to locate the failing code.
How do I pause code at a breakpoint?
Click the line number in the Sources panel to set a breakpoint. Run the action again to pause when that line executes.
Click the line number to set a breakpoint. Run again to pause at that line.
What is a logpoint and when should I use it?
A logpoint prints a message to the console without stopping execution. Use it to observe behavior in long-running tasks.
A logpoint prints messages without stopping code; great for long tasks.
How can I debug asynchronous code in Chrome?
Inspect async call stacks and promises in the Call Stack and Console to trace asynchronous flows.
Check the call stack for async flows and inspect promises in Console.
How do I ensure my fixes don’t break other parts?
Run quick regression tests and add or update unit tests that cover the bug scenario.
Run regression tests and update tests to cover the bug.
Watch Video
What to Remember
- Master Chrome DevTools basics for faster debugging
- Leverage breakpoints, logpoints, and call stacks
- Combine Console with Network and Performance tools
- Build a repeatable debugging workflow