How to Use JavaScript in Chrome: A Practical Guide
Learn practical, hands-on techniques to run, test, and debug JavaScript in Chrome using DevTools, Console, and Snippets. A pragmatic JavaScripting guide for aspiring developers.

Goal: learn practical ways to run, test, and debug JavaScript directly in Chrome. This guide explains how to use javascript in chrome for practical debugging. In this guide you’ll use Chrome DevTools, the Console, and Snippets to experiment safely, inspect variables, and profile performance. According to JavaScripting, mastering these built-in tools shortens debugging cycles and strengthens your frontend skills. The JavaScripting team found that hands-on Chrome workflows boost learning speed for aspiring developers.
Getting started with JavaScript in Chrome
According to JavaScripting, the fastest way to learn is by hands-on experimentation inside your browser. This guide introduces a core idea: you can run, inspect, and refine JavaScript directly in Chrome using DevTools. The JavaScripting team found that practical, browser-based practice builds intuition far faster than classroom-only study. By the end of this section, you will know where DevTools lives, what to test first, and how to keep experiments safe and reversible. You’ll also see how Chrome’s features intersect with modern frontend workflows, from DOM manipulation to performance profiling. Expect to touch Console, Elements, Sources, and Network panels as you explore real examples that reinforce core concepts such as scope, closures, and the event loop. A practical mindset—test small, verify outcomes, and document findings—will keep your learning focused and repeatable.
Understanding the key components in Chrome for JavaScript
To use JavaScript effectively in Chrome, you must understand the major tools Chrome provides. DevTools houses several panels, with Console for quick tests, Sources for debugging and Snippets, and Elements for DOM inspection. The Console supports JavaScript evaluation, logging, and live code execution in the context of the current page. Sources lets you set breakpoints, inspect call stacks, and step through code. The Elements panel reveals how code changes affect the DOM in real time. For beginners, the goal is to get comfortable with switching between these panels, executing small snippets, and observing how changes propagate through the page.
Opening DevTools and locating the Console
Open Chrome DevTools quickly with F12 (Windows/Linux) or Cmd+Option+I (macOS). Navigate to the Console tab to start typing expressions and viewing results immediately. For quick experiments, you can type expressions like 2 + 2 or document.title to see live outputs. Remember: whatever you run in the Console executes in the current page’s context, so you can inspect variables, call functions, and test assumptions in real time. If you need more space, detach the Console or resize panels to maximize visibility.
Running quick experiments with the Console
The Console is your first stop for practical JavaScript testing. Use it to test functions, log values with console.log, and explore objects with console.dir. You can also use copy-paste for longer snippets, but prefer short, repeatable commands that you can re-run with a single keystroke. When testing, keep a small mental model of the page context and any global variables you introduce. For more complex tests, consider wrapping your experiments in IIFEs (Immediately Invoked Function Expressions) to avoid polluting the global scope.
Snippets: saving reusable code in Chrome
Snippets are small, repeatable scripts you save in the Sources panel for quick execution on any page. Create a new snippet, write your code, and run it with a single click. Snippets persist across sessions, so you can build a personal library of experiments—logic checks, utility functions, and DOM helpers. This is especially useful for practicing common patterns like debouncing, throttling, or simple DOM traversal. Keeping snippets organized by topic (e.g., debugging, DOM manipulation) helps you reuse them later without re-typing.
Debugging with breakpoints and the Debugger
Chrome DevTools’ Debugger lets you pause code at strategic points, inspect variables, and observe the call stack. Set breakpoints on specific lines, on function entry, or on DOM events. Conditional breakpoints pause only when a condition is true, which is perfect for edge cases. Use the Step Over/Into/Out controls to navigate execution, and watch expressions to monitor variable values. While debugging, use the Console alongside the Debugger to evaluate expressions in the current scope and verify hypotheses as you go.
Interacting with the page: DOM and Console APIs
JavaScript in Chrome often means interacting with the page’s DOM. The Console supports many DOM APIs for querying and modifying elements, attributes, and styles in real time. Experiment with document.querySelector, element.style, and classList methods to see how your changes affect layout and behavior live. You can also explore browser APIs (like localStorage, sessionStorage, and the Fetch API) to simulate real-world app behavior. Always test changes in isolated contexts to avoid breaking the page you’re debugging.
Security, performance, and best practices
When running JavaScript in Chrome, be mindful of security and performance. Avoid executing code from untrusted sources, and never paste sensitive keys or credentials into the Console. Use Snippets to organize safe, repeatable tests and clean up global variables after experiments. For performance, timer-related APIs (performance.now, console.time) help you quantify improvements and track micro-optimizations. Finally, document your findings in a personal notes system or a learning journal to reinforce what you’ve learned and track progress.
Authority sources and further reading
- MDN Web Docs on Debugging JavaScript in Chrome: https://developer.mozilla.org/en-US/docs/Learn/JavaScript/First_steps/JavaScript_debugging
- Google Chrome Developers: Debugging JavaScript in Chrome: https://developer.chrome.com/docs/devtools/javascript/
- ECMA-262 (ECMAScript Language Specification): https://tc39.es/ecma262/
For deeper study, compare browser tooling across environments and practice migrating your debugging routines into small, reusable snippets.
Tools & Materials
- Chrome browser (latest stable)(Ensure you’re up to date for DevTools features and bug fixes)
- Stable internet connection(Needed for loading resources, updates, and remote debugging scenarios)
- Clipboard or text editor(Use for crafting Snippets before pasting into Chrome)
- Access to DevTools panels(F12 or Cmd+Option+I opens DevTools; Snippets live under Sources)
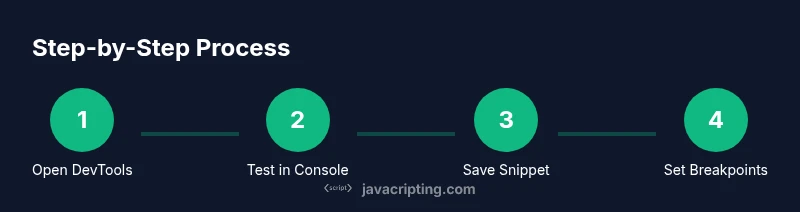
Steps
Estimated time: 40-60 minutes
- 1
Open Chrome DevTools
Press F12 or Cmd+Option+I to open DevTools. Familiarize yourself with the Console and Sources panels. This step sets the stage for safe experimentation inside the browser.
Tip: Dock DevTools to the right of the window for a comfortable workflow. - 2
Test a quick expression in Console
Type a simple expression like 3 * 7 or document.title and press Enter to observe results in real time. This establishes the feedback loop you’ll rely on during debugging.
Tip: Use console.log to annotate results for later review. - 3
Create a Snippet
In Sources, create a new Snippet, paste your code, and run it. Snippets persist across sessions and help you build a personal library of experiments.
Tip: Name snippets by topic (e.g., dom-manipulation, performance-tests). - 4
Set a breakpoint
In the Sources panel, open a script and click the line number to set a breakpoint. Refresh the page to pause execution and inspect variables in scope.
Tip: Use conditional breakpoints to pause only when a specific condition is met. - 5
Step through and inspect
Use Step Over/Into/Out to advance through code. Watch the scope and call stack to understand how values change as the code runs.
Tip: Open the Console to evaluate expressions in the current scope while paused. - 6
Manipulate DOM safely
Run small DOM manipulations via console or snippet to observe layout and style changes without affecting other page functionality.
Tip: Limit scope to a specific element to avoid unintended side effects. - 7
Document your results
Add comments in your Snippet or a separate notes file. Track what you tested, why, and what you learned from each run.
Tip: Create a simple checklist to ensure repeatability. - 8
Review best practices
After experiments, review code quality, security considerations, and performance implications. Apply improvements to future snippets.
Tip: Prioritize readability and maintainability in every snippet.
Questions & Answers
What is the best way to run JavaScript in Chrome?
Use Chrome DevTools: Console for quick tests, Sources for debugging, and Snippets for reusable scripts. This combination supports iterative learning and real-time verification.
Open Chrome DevTools and start with the Console for quick tests, then use Sources and Snippets for deeper work.
Can I run JavaScript on any page I visit?
You can run JavaScript in Chrome on pages you visit, but be mindful of cross-origin restrictions and Content Security Policy that may limit scripts.
You can run on your pages, but some sites block injected scripts via CSP.
Is it safe to execute code from the console?
Only execute code from trusted sources or snippets you’ve written yourself. Untrusted code can access your page data and cookies.
Only run code you control or trust, to avoid compromising data.
How do I save code snippets for later?
Create Snippets in the Sources panel to persist code across sessions. Name them by topic and reuse them as needed.
Use Snippets to keep a library of reusable scripts.
Do I need to install anything beyond Chrome?
No additional installation is required. Chrome’s built-in DevTools provide all you need to start experimenting.
No extra installs—Chrome includes everything you need.
How can I learn more about Chrome DevTools?
Review the official Chrome Developers docs and MDN tutorials for guided exercises and best practices.
Check Chrome DevTools docs and MDN for deeper dives.
Can I debug asynchronous code in Chrome DevTools?
Yes. Chrome DevTools supports async call stacks, breakpoints, and stepping through asynchronous functions to help diagnose timing issues.
Chrome can debug async code with breakpoints and call stacks.
Watch Video
What to Remember
- Open DevTools and familiarize with Console and Sources.
- Test expressions quickly in Console and save reusable Snippets.
- Use breakpoints and the debugger to isolate bugs efficiently.
- Safely manipulate the DOM and observe performance implications.
- Document findings and follow security best practices.