Javascript Debug Online: A Practical Guide
A practical guide to javascript debug online, using browser DevTools and online sandboxes to reproduce, inspect, and fix issues safely for frontend developers.

To javascript debug online, use browser DevTools and online editors. Open your browser console, set breakpoints, inspect variables, and test snippets in an online sandbox such as CodeSandbox or JSFiddle. Use console.assert, debugger keyword, and source maps to trace errors; validate network requests with the Network tab, and reproduce issues safely on isolated pages.
What 'javascript debug online' means
In its simplest form, javascript debug online refers to diagnosing and fixing JavaScript errors using tools that run in a web browser or inside online code editors. You don’t need to install heavy debuggers on your machine to get accurate feedback; modern browsers ship powerful debugging features, and several online platforms let you reproduce issues with isolated environments. According to JavaScripting, the shift toward online debugging mirrors a broader move toward reproducible, shareable workflows that speed up learning and collaboration. When you speak the language of console logs, breakpoints, and network traces, you gain visibility into how your code executes in real time, regardless of where it runs. This guide is designed for aspiring developers and frontend professionals who want practical, hands-on techniques for javascript debug online.
Getting the right online environment
Choosing the right environment is half the battle. For browser-based debugging, you’ll rely on built-in DevTools, which exist in Chrome, Edge, Firefox, and Safari. For experiments and quick repros, online sandboxes like CodeSandbox, JSFiddle, or CodePen provide instant editors and live previews. Online environments shine because you can share a reproducible snippet with teammates without exporting files. In addition to sandboxes, keep a simple local HTML page that mirrors the behavior you’re debugging so you can compare results across environments. The JavaScripting team emphasizes starting in a clean state: close unrelated tabs, disable extensions that could alter timing, and reserve one window for your test page. This makes it easier to notice what changes when you modify code.
Reproducing a bug in an online sandbox
To debug online, you first need a minimal, reliable repro. Strip the failing behavior down to the smallest snippet that still reproduces the issue. Use descriptive comments to mark the suspected area. In a sandbox, ensure you’re loading the exact version of your script and that there are no external caches skewing results. Reproduce with the same inputs each time, and document the expected vs. actual outputs. This clarity helps you avoid chasing phantom problems and makes it easier to validate a fix later. Remember to save snapshots of the console output and share the repro with teammates for quick feedback.
Mastering browser DevTools for online debugging
DevTools provide a set of complementary tools for diagnosing JavaScript problems. The Console shows runtime messages and can evaluate expressions on the fly. The Sources panel lets you set breakpoints, inspect the call stack, and examine local and global variables. The Network tab reveals requests, statuses, and timing, which are essential for debugging fetch-related bugs. Use Pretty Print for minified code, and enable source maps so your original code aligns with what runs in the browser. In online contexts, you’ll often rely on console.assert, console.table, and the debugger keyword to trigger pauses at meaningful moments.
Breakpoints and watch expressions
Strategic breakpoints minimize friction. Start with a global breakpoint at the entry point of the bug, then narrow to function-level breakpoints around the suspect logic. Conditional breakpoints allow pausing only when a condition is true, saving you from stepping through irrelevant iterations. Watch expressions keep an eye on critical variables as your code runs, especially inside asynchronous callbacks. When timing is critical, use performance.now() and the browser’s performance timeline to measure how long operations take. Remember to remove or disable breakpoints when you’re done to avoid slowing future work.
Debugging asynchronous code online
Asynchrony is a common source of bugs in JavaScript. When debugging, pay attention to promise chains, async/await, and callbacks that can run later. In a sandbox, reproduce race conditions by introducing deliberate delays or varying inputs. Use try/catch around awaited calls to surface errors, and log errors with meaningful context. If you rely on external APIs, mock those responses in your sandbox to isolate failures from network variability.
Inspecting network activity and source maps
Network activity often explains failures that aren’t obvious from code alone. Open the Network tab to inspect fetch/XHR requests, payload sizes, and response times. Verify that servers return the expected content types and that CORS policies aren’t blocking data. Source maps help you relate minified production code back to your original sources, which reduces guesswork when stepping through stack traces. Online environments frequently load compiled or bundled code, so always map errors back to your source files.
Testing fixes safely in sandboxes
After applying a fix, re-run the repro with the same inputs to confirm the issue is resolved. Use a small set of representative cases, including edge conditions. Keep test cases small and focused; larger test suites can mask the real issue. If possible, use versioned snippets so you can compare before/after outcomes. Finally, share the sandbox link with peers to solicit feedback and verify that the solution holds across environments.
Performance considerations when debugging online
Debugging in online environments can introduce latency from network access and sandbox overhead. Be mindful of timing differences between your local environment and the online editor. When measuring performance, run multiple iterations and consider warm-up runs to stabilize results. Avoid relying on micro-benchmarks alone; combine performance data with user-observable behavior. If you rely on third-party libraries, check their impact on bundle size and initialization time in your sandbox.
Common pitfalls and how to avoid them
Relying on console output as the sole truth is risky; logs can be misleading if timing changes are involved. Modifying global state without resetting it between runs can produce inconsistent results. Forgetting to clear breakpoints after a session wastes time later. Finally, never debugging production code in a public environment; always reproduce issues in a safe sandbox first.
Best practices and a quick checklist
- Start with a minimal repro
- Use DevTools features routinely
- Validate fixes across multiple sandboxes
- Document steps clearly
- Keep your environment clean and consistent
Documenting and sharing your debugging process
Documentation helps teammates learn from your debugging journey and reduces future friction. Record inputs, expected vs. actual results, and the exact code changes. Share a link to the sandbox along with concise notes summarizing the root cause and fix. Consider adding a short video or annotated screenshots to illustrate tricky moments. This habit turns individual debugging sessions into reusable knowledge for the team.
Tools & Materials
- Web browser with developer tools(Chrome/Edge/Firefox/Safari; ensure Console, Sources, and Network tabs are available)
- Stable internet connection(Reliable access to online sandboxes and API endpoints)
- Online code editors/sandboxes(CodeSandbox, CodePen, JSFiddle, or StackBlitz accounts)
- Minimal reproducible example(Small HTML/JS snippet that reproduces the bug exactly)
- Notes or screen recording(Optional, for documenting steps and sharing findings)
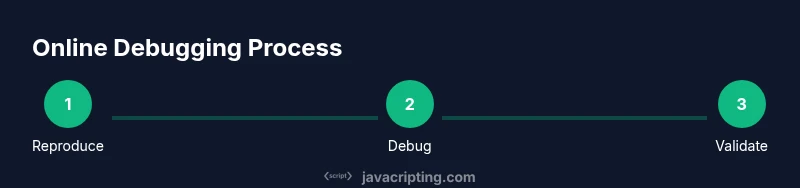
Steps
Estimated time: 40-60 minutes
- 1
Open debugging environment
Launch your browser and open DevTools. Start a new online sandbox or load your repro snippet to ensure you’re in a controlled environment. Verify the page renders as expected before you begin investigating.
Tip: Pin DevTools to stay focused; disable unrelated extensions that could alter timing. - 2
Reproduce the bug
Run the exact steps that trigger the issue in your sandbox. Note inputs, timing, and any visual changes. A clean repro makes it easier to isolate the root cause.
Tip: Keep a quick log of inputs and observed outputs alongside the repro code. - 3
Check console logs
Open the Console to inspect errors, warnings, and messages. Filter for errors, and copy stack traces to identify where the problem originates.
Tip: Use console.error for dynamic messages that help identify state during failure. - 4
Set breakpoints
Place breakpoints at key functions or suspected lines. Use conditional breakpoints to pause only when a specific condition is met.
Tip: Start at the entry point and narrow down progressively. - 5
Inspect state and call stacks
Examine variables, this context, and the call stack. Look for unexpected values or state mutations that explain the failure.
Tip: Add watch expressions for variables that change across steps. - 6
Step through and narrow down
Step into and over functions to view execution flow. Compare each step with your expected behavior to locate where things diverge.
Tip: Avoid over-stepping; use Step Over to skip irrelevant internals first. - 7
Apply a focused fix in the sandbox
Make a minimal change that addresses the root cause. Re-run the repro to ensure the fix resolves the issue without introducing new problems.
Tip: Aim for a one-change-at-a-time approach to verify impact clearly. - 8
Verify across environments
Test the fix in multiple sandboxes or browsers to confirm consistency. If possible, replicate on a minimal local page as a cross-check.
Tip: Document any environment-specific differences to avoid regression. - 9
Document and share
Summarize the root cause, fix, repro steps, and outcomes. Share a link to the sandbox with teammates and add brief notes for future reference.
Tip: Include a before/after snippet and key observations for quick learning.
Questions & Answers
What is the best way to start debugging online JavaScript?
Begin with a minimal repro in a sandbox, then use browser DevTools to inspect console output, set breakpoints, and verify behavior. Build understanding around one failing scenario before expanding tests.
Start with a tiny repro and DevTools to inspect and iterate quickly.
Can I debug Node.js code online?
Yes, some online editors support Node.js runtimes or provide a Node sandbox. For accurate results, mirror the environment locally when possible and use console logging and debugging tools compatible with the runtime.
You can debug Node.js code in compatible online sandboxes or by simulating Node locally.
Are online tools secure for debugging proprietary code?
Use trusted platforms and avoid uploading sensitive data. Prefer private sandboxes and clear any sensitive credentials from outputs or logs before sharing links.
Security matters; use trusted tools and avoid exposing secrets.
How should I handle asynchronous debugging online?
Focus on promises, async/await, and callbacks. Reproduce race conditions with deliberate delays and add context to errors to quickly identify root causes.
Handle promises and race conditions with careful reproduction and clear error context.
Which browser should I use for online debugging?
All major browsers have robust DevTools, but features and timings can differ. Test critical cases in at least two browsers to catch cross-browser issues.
Test in multiple browsers to catch differences.
How can I share debugging steps with my team?
Provide a concise repro, a link to the sandbox, and a brief summary of root cause and fix. Include before/after behavior and any caveats observed.
Share a clean repro, sandbox link, and a short fix summary.
Watch Video
What to Remember
- Master browser DevTools for fast insights
- Reproduce bugs with a minimal repro
- Leverage breakpoints and watches effectively
- Test fixes in safe online sandboxes
- Document steps for knowledge sharing
- Verify changes across environments before finalizing