How Fast Is JavaScript Compared to Other Languages: A Practical Guide
Explore how fast JavaScript is relative to languages like C++, Java, and Rust, with engine insights, workload context, and practical tips. Learn when WebAssembly helps and how to optimize for real-world apps in 2026.

How fast is JavaScript compared to other languages? The answer is nuanced: JavaScript speed depends on the engine (V8, SpiderMonkey, JavaScriptCore) and the workload (CPU-bound vs IO-bound). In typical web apps, expect snappy performance, but for heavy numeric workloads, compiled languages often pull ahead. This comparison explains why and how to optimize.
Why performance varies across engines
Performance in JavaScript is not a single number but a spectrum that shifts with the engine (V8, SpiderMonkey, JavaScriptCore), the platform (desktop vs mobile), and the workload. The JavaScript performance landscape hinges on how aggressively the engine JIT-compiles hot paths, how memory is managed, and how well the runtime optimizes hidden classes and inline caches. According to JavaScripting, the outcome of any benchmark depends on engine maturity, compiled optimizations, and runtime support. The central question—how fast is javascript compared to other languages—depends on whether you measure startup time, steady-state throughput, or latency under style of workloads. In practice, web apps that rely on event-driven code and DOM work tend to feel fast, especially when you use profiling to guide optimizations. The bottom line is: expect strong performance in typical UI tasks, but prepare to lean on additional technologies for compute-heavy workloads.
CPU-bound vs IO-bound: where speed matters
Speed is not universal across all tasks. In CPU-bound scenarios, languages with lower-level control or ahead-of-time compilation often close the gap or surpass JavaScript. JavaScript benefits from JIT compilers that optimize hot paths at runtime, but those optimizations may take time to “warm up,” which can affect startup latency. IO-bound tasks—such as network requests, streaming, or user input handling—tend to show smaller gaps between JavaScript and compiled languages because the bottleneck shifts away from pure computation. When evaluating performance, separate your workload into CPU-bound, IO-bound, and mixed categories to predict how JavaScript will perform in your app. This distinction is essential for making informed decisions about architecture and technology choices.
How JavaScript runtimes optimize: JIT, TurboFan, and friends
Modern JavaScript engines employ just-in-time (JIT) compilation, speculative optimizations, and adaptive optimization tiers. V8, SpiderMonkey, and JavaScriptCore continually monitor code paths to convert hot functions into optimized machine code. These optimizations dramatically boost throughput over time for long-running processes, but the initial interpretation phase can be slower than natively compiled code for some workloads. Understanding how the engine builds and invalidates inline caches, transitions between optimization tiers, and manages garbage collection helps you write code that remains friendly to the optimizer. The result is a performance curve that improves as applications stay “hot,” which is common in interactive apps and games.
Benchmarks vs real-world apps: what to trust
Benchmarks provide valuable guidance but may not reflect your app’s real-world behavior. Synthetic tests often stress micro-tasks that run for a few milliseconds, while production apps may run for hours with varying workloads. The most meaningful assessments come from profiling your own code, using representative data sets, and measuring end-to-end latency under realistic user traffic. JavaScripting analysis shows that the relative advantages of each language can flip depending on the task mix, memory pressure, and environment. When evaluating performance, prioritize realism and end-to-end user experience over isolated micro-benchmarks.
Memory management and GC pauses
JavaScript engines use garbage collection to manage memory, which can introduce pauses that affect latency. The impact varies by engine and by heap size, allocation rate, and object churn. For workloads with heavy dynamic allocations, frequent GC cycles can be noticeable, particularly on mobile devices or constrained hardware. Profiling GC behavior helps you identify hotspots and opportunities to reduce allocations, reuse objects, and minimize transient memory spikes. This is a central consideration when comparing JavaScript to languages with manual memory management or more predictable GC models.
WebAssembly: bridging the gap to near-native speeds
When you need compute-heavy performance, WebAssembly (Wasm) lets you move math- or data-intensive routines into a near-native module while keeping the JavaScript glue. Wasm modules can be compiled from C, C++, Rust, and other languages, and then invoked from JavaScript. This hybrid approach preserves the development conveniences of JavaScript while offloading intensive tasks to wasm. The practical result is substantial gains for tasks like image processing, scientific simulations, or cryptography, without abandoning the web platform’s portability and ecosystem.
The role of memory and allocation patterns
JavaScript performance improves when you reduce allocations in hot paths and reuse objects where possible. Patterns such as object pooling, avoiding unnecessary temporary objects, and using typed arrays for numeric workloads help engines optimize more efficiently. Memory locality matters: data structures with predictable access patterns allow better cache usage and faster execution. In practice, careful data layout and minimizing churn can noticeably improve both startup time and steady-state throughput.
Micro-optimizations that pay off
Small changes in hot loops and frequently called functions can yield meaningful gains. Ideas include avoiding frequent property lookups by caching results, using simple iteration patterns instead of high-level abstractions, and leveraging immutable data structures when safe. Remember that readability and maintainability should not be sacrificed for micro-optimizations—optimize after profiling shows a real bottleneck. Focus on hot paths and measurable improvements rather than speculative optimizations.
Browser vs Node.js: environment speed differences
JavaScript performance varies between browsers and server environments. Node.js often benefits from a stable, long-running process model and access to native bindings, while browsers must optimize for a wide array of devices, networks, and UI constraints. The engine version, runtime flags, and platform-specific optimizations all influence performance in these environments. If you’re building cross-platform code, profile in the target environments to understand the practical differences and tailor your optimizations accordingly.
Real-world task examples: web apps, games, data viz
Web apps centered on UI interactions, form handling, and incremental rendering generally benefit from the engine’s optimizations and efficient event loops. Games, 3D graphics, and heavy data visualization rely more on efficient math code and graphics pipelines—areas where wasm modules or offloaded worker threads can play a crucial role. Data-heavy dashboards should prioritize streaming updates, virtualization of DOM elements, and efficient state management to maintain responsiveness. By mapping task type to optimization strategy, you can achieve smoother experiences across devices.
Best practices: actionable steps to improve speed
Developers should start with profiling to locate bottlenecks, then iteratively apply targeted optimizations. Practical steps include: identify hot paths with flame graphs, minimize allocations in hot loops, prefer typed arrays for numeric workloads, use workers for parallel tasks, cache expensive computations, and adopt wasm for compute-intensive routines. Also, ensure you use modern language features that the engine optimizes well and avoid patterns that trigger de-optimization. A disciplined approach to profiling and incremental improvements compounds over time and yields meaningful performance gains in production.
Conclusion: performance is workload-dependent
The speed of JavaScript relative to other languages is not fixed; it shifts with engines, workloads, and implementation choices. For most web-focused tasks, JavaScript remains fast enough, particularly when optimized with profiling and best practices. For compute-heavy workloads, WebAssembly offers a path to near-native speeds while preserving the web’s advantages. The key is to align your tool choice with the workload and to adopt a rigorous performance discipline in development and testing.
comprehensiveness
wordCountInSection or length constraint not used in data model
Feature Comparison
| Feature | JavaScript (V8/SpiderMonkey/JavaScriptCore) | C++ | Rust (WebAssembly) | Java (JVM) |
|---|---|---|---|---|
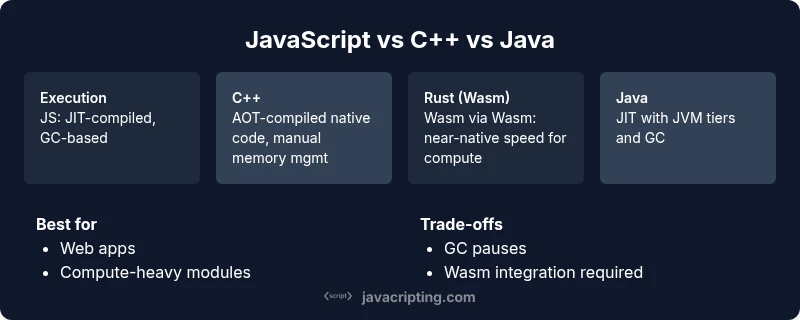
| Execution model | JIT-compiled, GC-based | AOT-compiled native code, manual memory management | WebAssembly/JIT-like or AOT paths with linear memory | JIT-compiled with GC in the JVM |
| Typical use case | Web apps, UI logic, scripting | System software, performance-critical libraries | Compute-heavy modules via Wasm or native bindings | Enterprise backends, cross-platform apps |
| Startup & warm-up | Fast startup; warm-up affects hot path performance | Minimal warm-up; steady-state is fast | Warm-up depends on Wasm compilation path | Varies by JVM warm-up and tiered compilation |
| Memory management | GC-based, potential pause variability | Manual memory management / RAII | Wasms with linear memory and optional GC | GC-managed with mature tuning options |
| Best for | Rapid UI development, scripting versatility | Low-level performance tasks | Compute-heavy routines via Wasm or native modules | Cross-platform server-side and enterprise apps |
Benefits
- Fast iteration and rich tooling support for web apps
- WebAssembly enables near-native speed for compute tasks
- Mature ecosystems and profiling tools across engines
- Strong suitability for IO-bound, event-driven workloads
The Bad
- GC pauses can introduce latency in interactive apps
- Warm-up/down phases affect microbenchmarks and startup time
- Not all workloads benefit from JavaScript optimizations
- Cross-environment performance can vary widely by engine and device
JavaScript is fast for typical web workloads, but for compute-heavy tasks, WebAssembly and careful profiling make it competitive with native approaches.
Use JavaScript for UI, interaction, and IO-bound tasks where it shines. For CPU-intensive workloads, consider wasm modules or native bindings. Profile, optimize, and choose the right tool per task to maximize performance.
Questions & Answers
How does JavaScript's performance compare to C++ or Java in practice?
In practice, JavaScript often trails fully compiled languages in raw CPU throughput, especially for compute-heavy numerical tasks. However, for most web apps, engine optimizations, efficient APIs, and asynchronous patterns keep the experience smooth. WebAssembly can close the gap by offloading heavy work to near-native code.
For compute-heavy tasks, pure JavaScript tends to be slower than C++ or Java, but for UI and web app logic, it’s typically fast enough, especially with WebAssembly when needed.
Can WebAssembly make JavaScript as fast as native code?
WebAssembly can dramatically improve performance for compute-bound tasks by running code close to native speed, but it requires careful integration and data exchange with JavaScript. Wasm shines for math, image processing, and algorithms with heavy numerical work.
Yes, Wasm can boost heavy computations, but you still coordinate with JavaScript for I/O and UI.
Which tasks should I port to WebAssembly?
Port compute-heavy components such as image processing, simulations, cryptography, and numerical libraries to WebAssembly. Keep control flow and data involved with JavaScript when interacting with DOM, networking, or high-level app logic.
Port the heavy math and data-processing parts to Wasm, then glue them to JS for UI and I/O.
How do I measure JavaScript performance effectively?
Use profiling tools (CPU, memory, GC) in target environments, create representative workloads, and measure end-to-end latency. Focus on hot paths, startup time, and frame rates for interactive apps.
Profile startup, hot loops, and GC pauses to surface real bottlenecks.
Do all browsers run JavaScript at the same speed?
No. Browser engines differ in optimization paths and garbage collection strategies. Always test across major browsers and devices relevant to your user base.
Different browsers can have different performance characteristics; test where your users are.
Is Node.js faster than browser JS for server workloads?
Node.js benefits from a stable runtime with native bindings and fewer UI constraints, but raw computation time depends on the task and bindings used. Benchmarks should reflect realistic server workloads.
Node performance varies with workload and bindings; profile in server contexts.
What to Remember
- Profile early and measure on target devices
- Leverage WebAssembly for compute-heavy tasks
- Favor hot-path optimizations over broad-scope changes
- Different engines yield different performance; test across environments
- Memory management and allocations matter for latency
- Use workers and virtualization to keep UI responsive