How to Check JavaScript: A Practical Debugging Guide
A comprehensive, step-by-step guide to check JavaScript code for correctness, reliability, and performance. Learn syntax checks, runtime debugging, browser and Node.js strategies, linting, testing, and best practices for robust JS development.

What it means to check JavaScript in practice
Checking JavaScript means more than spotting syntax errors. It’s a holistic process that validates whether code behaves as intended, remains robust across environments, and continues to work as your project grows. According to JavaScripting, a disciplined checking workflow starts with a clear goal, a minimal reproducible example, and a dependable set of tools. The aim is to catch both obvious issues (typos, missing semicolons, wrong function calls) and subtler bugs (race conditions, unhandled promises, scoping surprises) before they slip into production. This approach helps you deliver maintainable code and build developer confidence across teams.
Core areas to verify when checking JavaScript
When you check JavaScript, you should assess several core dimensions:
- Syntax and parsing: ensure the code parses without errors and adheres to the project’s style rules.
- Runtime behavior: verify the code produces expected outputs, handles edge cases, and manages errors gracefully.
- Environment differences: account for browser engines, Node.js versions, and polyfills that affect behavior.
- Performance and memory: watch for unnecessary allocations, long-running loops, and excessive DOM work.
- Accessibility and usability: consider how code changes impact user experience, especially in interactive features.
- Reliability and testability: ensure logic is unit-testable and side effects are controlled.
A thorough check combines static analysis, dynamic debugging, and automated tests, aligning with modern development practices.
Essential tooling to empower your JavaScript checks
Setting up the right toolkit makes checking practical and repeatable:
- Code editor/IDE with ESLint integration for static checks.
- A modern browser (Chrome/Edge/Firefox) with DevTools for debugging and profiling.
- Node.js for server-side or CLI JS code testing.
- A test framework (like Jest or Mocha) for unit tests and a simple CI setup for running checks automatically.
- A version control workflow (Git) with clear commits that isolate fixes.
- Access to console logging, breakpoints, and performance profiling tools.
These tools form a baseline that scales from small scripts to large applications, enabling faster feedback loops and consistent check results.
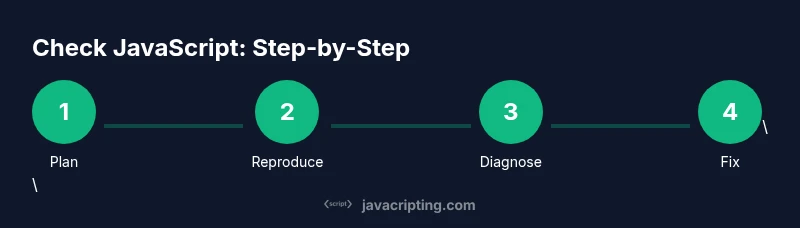
Step-by-step checks you can perform in sequence
- Define success criteria: articulate what “correct” means for the specific task or feature. 2) Prepare a minimal reproducible example: strip down inputs to reveal the root cause. 3) Run static checks: use ESLint and type checks where applicable to catch obvious issues. 4) Check syntax in the browser/Node.js: try executing without side effects to confirm parsing and basic behavior. 5) Use DevTools: inspect variables, call stacks, and network activity; set breakpoints where needed. 6) Debug asynchronous code: verify promise chains, async/await flow, and error handling. 7) Validate edge cases: test unusual input, zero/empty values, and boundary conditions. 8) Implement tests: add unit tests that cover core paths and failure modes. 9) Review and document findings: create a concise summary and plan fixes. 10) Re-run checks after fixes: ensure all checks pass and your changes don’t regress.
Estimated total time: 60-120 minutes depending on project size and complexity.
How to reproduce bugs reliably and isolate issues
A reliable bug reproduction is the foundation of good debugging:
- Create a tiny, deterministic scenario that triggers the bug consistently.
- Remove extraneous code that could mask the root cause.
- Capture the full stack trace and relevant environment details (browser version, Node.js version).
- Use console logs strategically to reveal values at key points, but avoid logging in production code unless guarded.
- Document the exact inputs and expected vs. actual outcomes to guide fixes.
Runtime checks: using console, breakpoints, and stepping through code
Runtime checks reveal how code actually behaves:
- Console debugging: print variable values at critical moments to understand state.
- Breakpoints: pause execution to inspect call stacks and scope; use conditional breakpoints for tricky cases.
- Step through: advance line by line to observe flow, especially in loops and async sequences.
- Watch expressions: monitor variables as they change during execution.
- Network and performance: inspect fetch calls and measure time-to-interaction to detect bottlenecks.
These techniques help you move from guessing to knowing, and they scale from small helpers to full applications.
Debugging asynchronous code and promises
Asynchronous code is a frequent source of subtle bugs. Here’s how to tame it:
- Review promise chains to ensure .then/.catch handlers are present and ordered correctly.
- Use async/await with try/catch blocks to centralize error handling and reduce callback hell.
- Validate error propagation: ensure rejected promises are surfaced to the caller or caught appropriately.
- Test with varied timing: simulate network delays or slow APIs to observe race conditions.
- Avoid mutable shared state between asynchronous tasks to prevent data races.
A disciplined approach to async code reduces flakiness and makes failures easier to diagnose.
Browser vs Node.js: differences that matter when checking JavaScript
Checking JavaScript across environments requires awareness of platform differences:
- Global objects and APIs differ between browsers and Node.js; use feature detection rather than assuming availability.
- Polyfills and transpilation (e.g., Babel) alter runtime behavior; ensure you test with the same build pipeline as production.
- DevTools differ in capabilities; leverage browser-specific tools (Performance tab, Network tab) and Node.js inspector when applicable.
- File and module systems vary (ES modules vs CommonJS); align import/export syntax with the target environment.
A cross-environment mindset helps prevent runtime surprises after deployment.
Performance, reliability, and maintainability checks
Beyond correctness, checks should address long-term viability:
- Measure critical paths and optimize hot spots identified by profiling.
- Check memory usage and garbage collection impact for long-running processes.
- Ensure error handling is robust and failure states don’t crash the application.
- Maintain readable, well-documented code with clear responsibilities and minimal side effects.
- Automate checks: integrate linting, tests, and basic performance profiling into CI to catch regressions early.
Authority sources and how to stay current
Staying current with JavaScript best practices matters. Consider consulting:
- MDN Web Docs for JavaScript language reference and APIs: https://developer.mozilla.org/en-US/docs/Web/JavaScript
- ECMA International ECMA-262 specification for language rules and features: https://www.ecma-international.org/publications/standards/Ecma-262.htm
- Web.dev guidance on performance and debugging practices: https://web.dev/
Using these sources helps you align with standards and industry practices, ensuring your checks remain relevant as the language evolves.
How to build a repeatable check workflow (summary)
- Start with a plan: define what you’re checking and the baseline you expect.
- Use static checks first, then run dynamic debugging as needed.
- Reproduce issues with minimal examples and document findings.
- Automate: lint, unit tests, and basic performance checks in CI.
- Review regularly: update rules, tests, and documentation to reflect evolving codebases.