Where is javascript console in chrome: A practical guide
Learn where javascript console in chrome lives in Chrome DevTools, how to open it, and practical debugging tips to improve your JavaScript workflows.

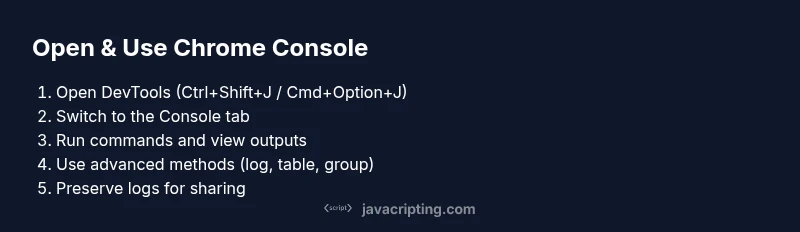
To answer where is javascript console in chrome: open Chrome, press Ctrl+Shift+J (Windows/Linux) or Cmd+Option+J (macOS) to open DevTools Console, or right-click a page and select Inspect. Then switch to the Console tab to run commands, view logs, and debug in real time. Once open, you can enter JavaScript expressions, view errors, and experiment with console APIs like log, table, and group.
What the Chrome JavaScript Console is and why it matters
According to JavaScripting, the Chrome JavaScript Console is a core part of Chrome DevTools that lets you execute JavaScript, log information, and observe runtime behavior without leaving the browser. It’s a low-friction sandbox for learning, prototyping, and debugging real pages. By leveraging console methods, you can observe outputs, catch errors, and validate assumptions in real time. For beginners, this is often the first structured way to understand how JavaScript interacts with the DOM, events, and asynchronous operations. If you are asking where is javascript console in chrome, this section helps you orient DevTools around the Console panel and explains why it’s so valuable for day-to-day debugging and learning.
The console isn’t just a place to print messages. It also gives you access to the global scope, lets you evaluate expressions on the current page, and serves as a quick testing ground for small code snippets. JavaScripting’s approach emphasizes hands-on practice: log results, compare values with deep equality, and progressively build up more complex snippets. The more you use the console, the more you’ll internalize how JavaScript executes in a browser and how various APIs respond in real time.
note: null
Tools & Materials
- Chrome browser (latest version)(Any modern channel will do; ensure DevTools is accessible)
- Target web page URL (local or remote)(A page you can inspect and test commands on)
- Sample JavaScript snippets(Include commands like console.log, console.table, and console.group)
- Text editor or snippet storage(Helpful for saving reusable console snippets)
- Notebook or note-taking app(Record commands and observed outputs for later reference)
Steps
Estimated time: 15-25 minutes
- 1
Open Chrome DevTools
Open Chrome on your test page, then open DevTools by right-clicking and selecting Inspect, or use the shortcut Ctrl+Shift+I (Windows/Linux) or Cmd+Option+I (macOS). This step is essential to access the console where JavaScript runs in the context of the current page.
Tip: If DevTools is docked to the right or bottom, switch to a layout that gives you a comfortable console view. - 2
Switch to the Console panel
Click the Console tab within DevTools, or press Esc to toggle the Console drawer if DevTools is docked. The Console shows logs, errors, and evaluation results live as you interact with the page.
Tip: Use the Command Palette (Ctrl+Shift+P / Cmd+Shift+P) to quickly switch panels. - 3
Run a test command
Click the command line at the bottom of the Console and type a simple expression like console.log('Hello, console') or 2+2. Press Enter to execute and observe the result immediately.
Tip: Start with logging a string, then log objects/arrays for clarity. - 4
Explore common Console APIs
Try console.table({name:'Ada', role:'Engineer'}), console.warn('Warning!'), and console.error(new Error('Demo')). These help you visualize data and differentiate message severities.
Tip: Group related logs with console.group and end with console.groupEnd to keep outputs organized. - 5
Preserve logs and share findings
Enable Preserve log in the Console’s settings to keep logs after navigation or reload. Use Copy Object to clipboard or Copy Response for sharing results with teammates.
Tip: Preserve logs is essential when debugging cross-page interactions or flaky network calls. - 6
Practice on a small bug
Create a tiny snippet that reproduces a bug, then use the Console to inspect variables, return values, and call stacks. Adjust variables and re-run to observe changes.
Tip: Use breakpoints if a quick check isn’t enough; the console complements breakpoints, not replaces them.
Questions & Answers
Where is the console in Chrome?
The Console is part of Chrome DevTools. Open DevTools with Ctrl+Shift+J (or Cmd+Option+J on macOS) to access the Console panel for JavaScript logging and testing.
Open Chrome DevTools to access the Console panel for quick debugging.
How do I open the Console quickly?
Use the shortcut Ctrl+Shift+J on Windows/Linux or Cmd+Option+J on macOS, or right-click a page and select Inspect to reach DevTools, then switch to Console.
Use the DevTools shortcut to jump straight to Console.
Can I debug on mobile with the console?
You can debug mobile pages by enabling Remote Debugging via Chrome on your desktop and connecting a mobile device, then using the Console in DevTools on desktop to inspect the mobile page.
Yes, via remote debugging from desktop DevTools.
Is the Console the same in all Chrome versions?
The Console features and shortcuts are broadly consistent, but some API details and UI layouts can vary between Chrome versions.
Mostly the same across versions, with minor UI changes.
How do I clear or save console output?
Use the Clear Console button or press Ctrl+L. To share results, copy logs or use Preserve log to retain data across reloads.
Clear or copy logs as needed; preserve logs for later sharing.
Watch Video
What to Remember
- Open DevTools quickly with keyboard shortcuts.
- Switch to the Console to run JavaScript and inspect results.
- Leverage log, table, and group to organize output.
- Preserve logs across reloads for debugging sessions.
- Avoid exposing sensitive data in console outputs.